Data Processing
DISDRODATA - Windows Software for Data Acquisition
The purpose of this software program is to enable users of an RD-80 or RD-69 disdrometer to record and evaluate drop size measurements with a personal computer or notebook based on Windows. This paper will briefly describe the theoretical background of drop size measurements with the disdrometer and it's implementation in the present program.
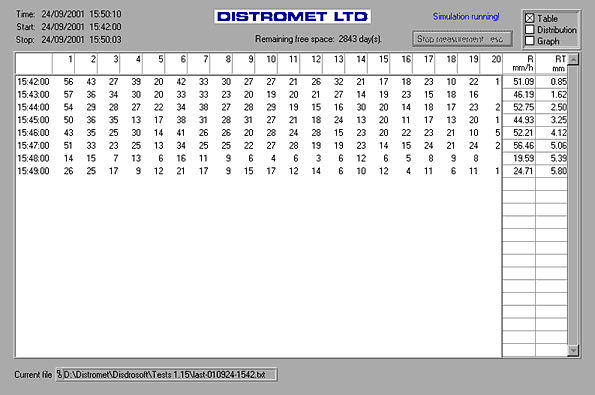
The disdrometer distinguishes 127 classes of drop diameter. To reduce the amount of data and to get statistically meaningfull samples, the 127 drop size channels of the RS-232 output are combined into 20 drop size classes distributed more or less exponentially over the available range of drop diameters by the DISDRODATA program. The number of drops in each drop size class is integrated over one minute to form an individual measurement. All the measurements are combined into a file. All data files are identified automatically by their starting time.
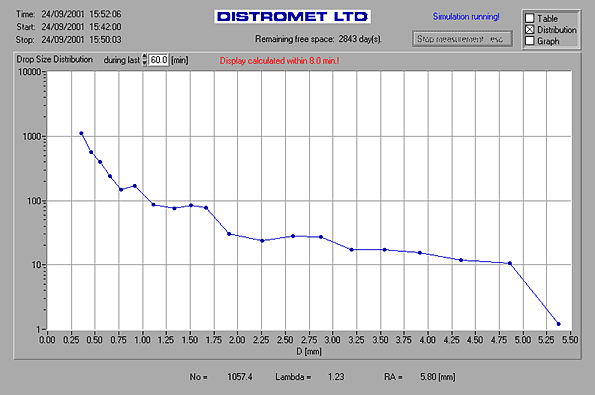
A rain drop size distribution is commonly represented by the function N(D), the number concentration of rain drops with the diameter D in a given volume of air. Because of the complicated processes involved in the formation of precipitation the function N(D) is very variable and cannot be given in a simple form. In many cases however a drop size distribution can be approximated fairly well by an exponential law and the following parameterisation can be used to characterise it:

where N0 is the number concentration of drops with diameter 0 on the exponential approximation and Λ LAMBDA is it's slope.
In many practical cases where knowledge of the whole drop size distribution is not necessary, other quantities derived from the drop size distribution like rainfall rate R, liquid water content in a given volume W, radar reflectivity factor Z etc. can be used.
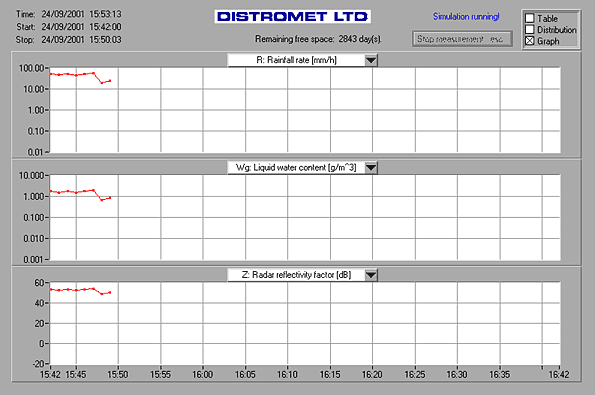
The following quantities are displayed during the process of data acquisition:
| ni | number of drops measured in every drop size class i during time interval t |
| R | Rainfall rate, [mm/h] |
| RT | Total rain amount since the start of the measurement, [mm] |
| Wg | Liquid water content, [g/m3] |
| ZdB | Radar reflectivity factor, [dB] |
| EF | Energy flux, [J/(m2 . h)] |
| Dmax | Largest drop collected, [mm] |
| N0 | [1/(m3.mm)] |
| Λ | Slope [1/mm] |
| RA | Rain amount, [mm] |
| N(Di) | the number density of drops of the diameter corresponding to size class i per unit volume, [1/(m3.mm)] (Graph only) |
All quantities, R through RA, are calculated for time intervals of t = 60 seconds and the results are transfered to the current output file.
In addition the distribution N(Di), No, Lambda and RA are calculated for a time interval between 1 and 60 minutes. This time interval can be specified in the display showing the distribution.


